Working with the DWO » The graph tool
If you see this button in an exercise:

then you know (from now on) that you probably have to use the graph tool.
You can show it by clicking on this button.
The graph tool will appear and looks like this:
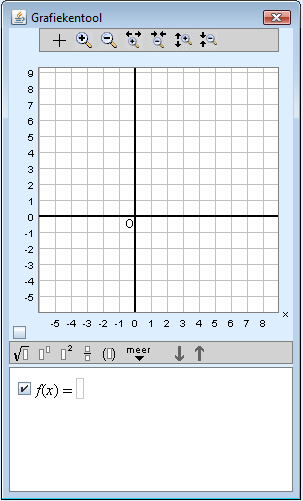
This tool will draw graphs for you. Sometimes you have to fill in the function yourself.
For example: 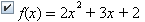
After keying in this function, press the enter key on you keyboard.
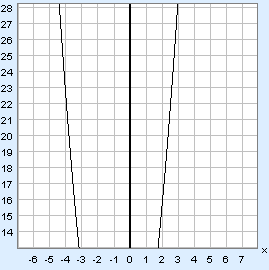
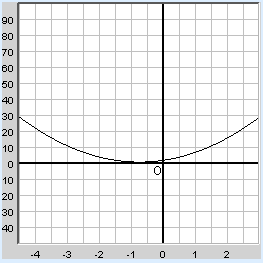
You will see that the graph will be drawn in the graph tool:
You can now do the following things.
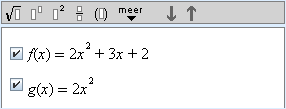
1: You draw another extra graph.
Once you have filled in function f (x), the  -button will appear and clicking on it will put a line with g(x) underneath f (x). You can add more than one function.
Remember to check the little box left of the function to draw the graph of that function.
2: You want to scroll/move the window view.
You might not see the whole graph and move the window. While clicking in the graph, move your mouse.
To put the graph back to its original view, click on  .
.
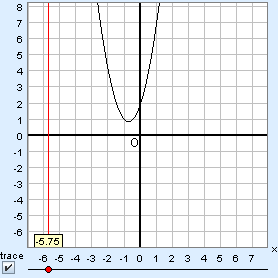
3: Zooming in or out.
You can use the following buttons for zooming in and out:
 will zoom in the horizontal axis.
 will zoom out the horizontal axis.
 will zoom in the vertical axis.
 will zoom out the vertical axis.
 will zoom in both axes.
 will zoom out both axes.
To put the graph back to its original view, click on .
4: Getting coordinates.
Check the box for 'trace':  .
.
If you drag the red ball ( ) along the line, you will see the red line moving as well. The yellow boxes will give you the coordinates of the point on the graph:
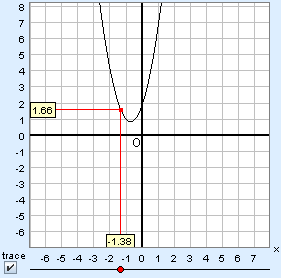
In that manner you can read off that when x = –1.38, y = 1.66.