Formulas, graphs & relations » Linear and directly proportional relation
Contents
1. General2. Formula
3. Table (incl. making formulas)
4. Graph (incl. making formulas)
5. Making formulas if you only know coordinates
1. General
In a linear relation you have a regular increase or decrease.
A directly proportional relation is a linear relation that passes through the origin.
2. Formula
The formula of a linear relation is always of the type y = ax + b. With a the gradient and b the y-intercept.
The gradient is the increase per x. In case of a decrease, the gradient is negative.
The y-intercept is the y-coordinate of the intersection of the graph with the y-axis.
In case of a directly proportional relation, this intersection is in the origin so b = 0.
Therefore, the formula of a directly proportional relation is always of the type y = ax.
3. Table (incl. making formulas)
In a table that corresponds to a linear or directly proportional relation it is easy to recognize the regular increase, provided the numbers in the top row of the table also have a regular increase.
In case of a directly proportional relation there will always be x = 0 above y = 0. The table for a directly proportional relation is always a ratio table. You can multiply the top row with a certain factor to get the answers in the bottom row (this factor is the gradient).
Example 1
| x | 0 | 1 | 2 | 3 | 4 | |||||
| y | 6 | 9 | 12 | 15 | 18 | |||||
 +3 |
+3 |
+3 |
+3 |
|||||||
In the table above the increase for every x is 3. Therefore the gradient is 3.
At x = 0 you can read off that the y-intercept is 6.
The formula for this table is therefore y = 3x + 6.
Example 2
+3 |
+3 |
|||||
| x | 2 | 5 | 8 | |||
| y | 23 | 15,5 | 8 | |||
–7,5 |
–7,5 |
|||||
The regular increase in the top row is 3 and in the bottom row –7.5. This means that per x you have an increase of –7,5 : 3 = –2.5. This is the gradient.
The y-intercept cannot be read off immediately, for x = 0 is not in the table.
We shall have to calculate back from (2, 23). One step to the right is –2,5. One step
to the left is therefore + 2,5. We need to go two steps, so b = 23 + 2 × 2.5 = 28.
The formula for this table is therefore y = –2,5x + 28.
Example 3
| +2 |
+2 |
+3 |
+4 |
|||||||
| x | 0 | 2 | 4 | 7 | 11 | |||||
| y | 0 | 7 | 14 | 24,5 | 38,5 | |||||
+7 |
+7 |
+10,5 |
+14 |
|||||||
The gradient can be found in two ways.
| 1. | The increase for the first column is +7, but this is for an increase of 2 for x. Per x you will have an increase 7 : 2 = 3.5. If it is unknown that the table belongs to a linear relation, check this increase also for the other columns. |
| 2. | Because of (0, 0) this table must be about a directly proportional relation. See if you can find the factor with which you have to multiply the top row to get the bottom row (divide the numbers in the bottom row by the numbers in the top row). If this is the same factor every time, you have linear relation and this factor is the gradient (= 3.5). The formula for this table is therefore y = 3.5x. |
4. Graph (incl. making formulas)
A graph for a linear relation is always a straight line.
The greater the gradient, the steeper the graph. In case of a negative gradient, you will have a falling line.
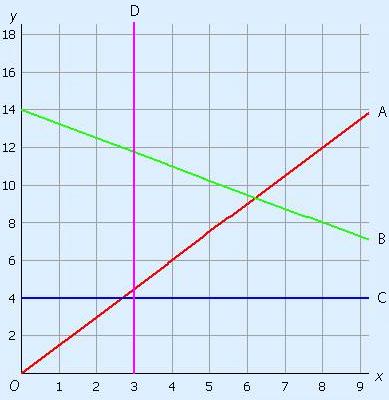
Note, the purple graph (D) is NOT a linear graph, but is often taught in chapters about linear formulas.
How do you make a formula for a linear graph?
Use y = ax + b where a is the gradient and b the y-intercept.
The increase per x (gradient) is not always easy to read off, in that case you need to calculate it with the following formula.
a = vertical differencehorizontal difference
You always choose two distinct points on the graph, preferably grid points.
With two points (x1, y1) and (x2, y2) you can calculate the gradient with:
a = y2 – y1x2 – x1
The y-intercept can be read off on the vertical axis (often the y-axis). The y-intercept is the y-coordinate of the intersection with the y-axis.
Examples
Red (A):
Goes from (0, 0) to (4, 6).
So a = 6 – 04 – 0 = 64 = 1.5 and b = 0. Formula is y = 1.5x.
Green (B):
Goes from (0, 14) to (8, 8).
So a = 8 – 148 – 0 = –34 = –0.75 and b = 14. Formula is y = –0.75x + 14.
Blue (C):
Horizontal line, no increase or decrease so a = 0 and b = 4. Formula is y = 4.
Purple (D):
Has no gradient or y-intercept. You cannot make a linear formula for this line. Because the line has x = 3 in each point, the covenant is that the formula for this line is x = 3.
5. Making formulas if you only know coordinates
If you only know two coordinates, it is also possible to make the linear formula.
Again you use y = ax + b with a the gradient and b the y-intercept.
a = vertical differencehorizontal difference. = y2 – y1x2 – x1
The y-intercept you calculate by using an equation.
Example 1
Give the formula for the line that goes through the points (3, –5) and (7, 15).
a = 15 – –57 – 3 = 204 = 5
Filling in the calculated gradient into the formula gives y= 5x + b.
Because of the given points you know that when you fill in x = 7, you have to have the outcome y = 15. Therefore you can make an equation by filling in 7 and 15:
| 15 | = 5 × 7 + b |
| 15 | = 35 + b |
| b | = –20 |
The formula is y = 5x – 20.
(You can also fill in x = 3 and y = –5 to calculate b)
Example 2
Give the formula for the line that goes through the points (–4, 17) and (5, –1).
a = –1 – 175 – –4 = –189 = –2
Filling in the calculated gradient into the formula gives y = –2x + b.
Because of the given points you know that when you fill in x = 5, you have to have the outcome y = –1. Therefore you can make an equation by filling in 5 and –1:
| –1 | = –2 × 5 + b |
| –1 | = –10 + b |
| b | = 9 |
The formula is y = –2x + 9.
(You can also fill in x = –4 and y = 17 to calculate b)