Formulas, graphs & relations » Periodic relation
Contents
1. General2. Formula
3. Graph
4. Amplitude, mean value and period
1. General
Graphs that repeat themselves continuously are called period graphs.
These graphs repeat with a certain time span which is called the period.
The number of periods during a unit of time is called the frequency.
Periodic relations appear with for example oscillations, waves and the height of the valve in you bicycle wheel.
2. Formula
Not all periodic graphs have a corresponding formula. In case they do, this formula is called a sinusoid. Such a formula is of the type y = sin(x) or y = cos(x).
Check sinusoid for more information about sinusoids.
You have to put your calculator in 'radian' mode when working with periodic formulas.
3. Graph
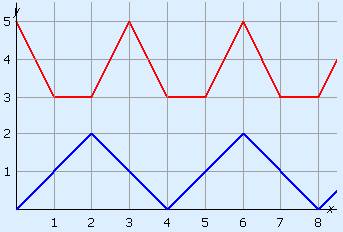
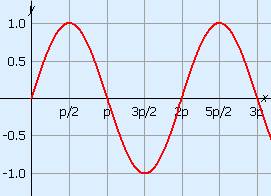
A periodic graph repeats it self. Below three examples.
This is the graph of y = sin(x).
4. Amplitude, mean value and period
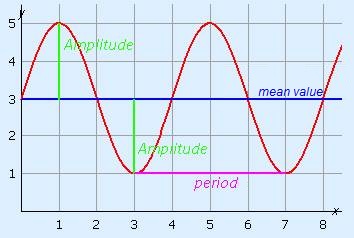
The mean value is the line where the graph fluctuates around.
The highest point of this graph is at y = 5 and the lowest point at y = 1,
so the mean value is y = (5 + 1) : 2 = 3.
The amplitude is the maximum deviation. The distance between the mean value and the highest or lowest point. For this graph that is 2.
The period is the regular time interval of the graph. For this graph it is 4.
Note:
In these graphs the relation is often between time and height.
In that case the mean value, amplitude and the period all have units.