Statistics » Frequency polygon / line graph
What is a frequency polygon?
A frequency polygon is a line graph. The points are often not connected with a smooth line, but with straight line segments.
Frequency polygons are used to show the changes over time.
How do you make a frequency polygon / line graph?
You can do it the same way as you make a graph.
Remember to use the same scale and you are also allowed to use a zigzag on the vertical axis.
Examples
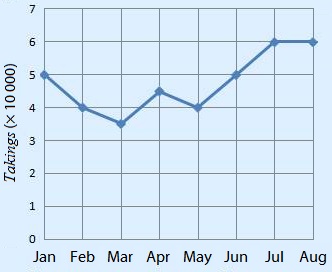
In the table you can find the takings of a snack bar.
| Month | Jan | Feb | Mar | Apr | May | Jun | Jul | Aug |
| Takings (× 10 000) | 5 | 4 | 3.5 | 4.5 | 4 | 5 | 6 | 6 |
You can make the following line graph.