Formulas, graphs & relations » Exponential relation
Contents
1. General2. Formula
3. Table
4. Graph
5. Making formulas
1. General
An exponential relation is a relation in which one of the variables is an exponent. You use these relations when working for example with growth factors or interest after interest.
2. Formula
As said one of the variables needs to be an exponent.
The formulas are always of the type: h = b · gt
For the multiplication, often a dot is used, instead of a ×-sign.
Examples are y = 50 · 0.73x and h = 12 · 1.03t.
3. Table
Below you will see a table that corresponds to a exponential relation.
| t | 0 | 1 | 2 | 3 | 4 | 5 | ||||||
| h | 600 | 630 | 661.5 | 694.575 | 729.303... | 765.769... | ||||||
 ×1.05 |
×1.05 |
×1.05 |
×1.05 |
||||||||
When there is a constant increase in the top row of the table, you have to be able to multiply with the same number in the bottom row. When all the factors at the arrows are slightly different but rounded off always the same number, you may also speak of an exponential relation. The deviation is then because the numbers in the table are rounded numbers.
4. Graph
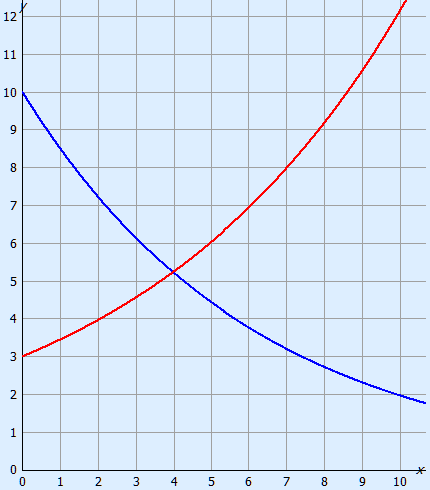
The graph of an exponential relation is either an increasingly steeper rising line (growth factor greater than 1) or an increasingly slower falling falling line (growth factor between 0 and 1).
5. Making formulas
The formula is always of the type h = b · gt
Where b is the initial amount (t = 0) and g is the growth factor.
See the table underneath for a couple of examples of growth factors.
| In- or decrease in % | growth factor |
| increase 5% | 1.05 |
| increase 8.5% | 1.085 |
| decrease 12% | 0.88 |
| decrease 3.5% | 0.965 |
Example 1
In a savings account is 1500 euros and every year 3.5% interest is received.
The formula you can calculate the amount a on the savings account after t years is:
a = 1500 · 1.035t
Example 2
A tree is 8 m high. Every year the tree grows with 6%.
The formula with which you can calculate the height h of the tree after t years is:
h = 8 · 1.06t
Example 3
A car has a new price of 35 000 euros. Every year the car loses 10% of its worth.
The formula with which you can calculate the value v of the car after t years is:
v = 35 000 · 0.9t
Example 4: Making formula for a graph.
Let's take the red graph above. We can clearly read off points (0, 3) and (7, 8).
The initial amount is 3 because of (0, 3), when we fill that in we get y = 3 · gx
Now we will fill in the other point (x = 7 and y = 8).
We will get an equation which we can solve.
| 8 | = 3 · g7 |
| g7 | = 8 : 3 |
| g | =  = (8 : 3)17 ≈ 1.15 = (8 : 3)17 ≈ 1.15 |
The formula will therefore be y = 3 · 1.15x
Example 5: Making formula for a graph.
Now the blue graph. We can clearly read off points (0, 10) and (10, 2).
The initial amount is 10 because of (0, 10), when we fill that in we get y = 10 · gx
Now we will fill in the other point (x = 10 and y = 2).
We will get an equation which we can solve.
| 2 | = 10 · g10 |
| g10 | = 0.2 |
| g | =  = 0.2110 ≈ 0.85 = 0.2110 ≈ 0.85 |
The formula will therefore be y = 10 · 0.85x