Formulas, graphs & relations » Graphs (basis)
Contents
1. What is a graph?2. Rising, falling, constant and scale
3. How do you plot a graph?
1. What is a graph?
Below you find a couple of examples.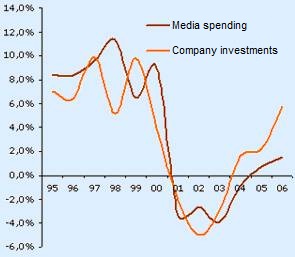
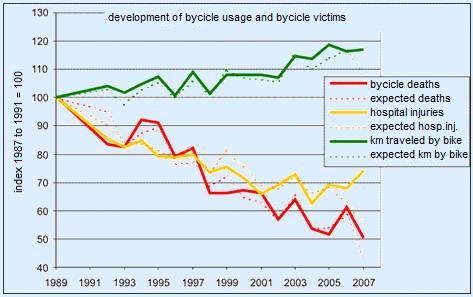
These graphs are used to get a clear picture of certain data, it makes it easier to compare them. You can plot graphs that correspond to formulas. This is the most common usage of graphs within mathematics. The coloured lines are the graphs. The straight number lines are called axes (singular = axis). Together they make a coordinate system. You always have a horizontal and vertical axis. The point of intersection of the two axes is called the origin. For that reason you often write the letter O at the origin.
2. Rising, falling, constant and scale
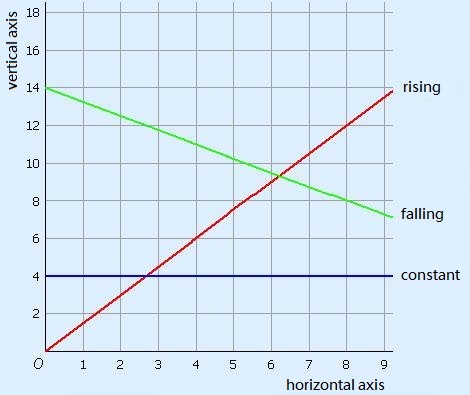
The red graph is a line that rises. The green graph is a line that falls. The blue graph is constant or horizontal.
The horizontal axis has a scale of 1. The vertical axis has a scale of 2.
3. How do you plot a graph?
To plot a graph you need data. You can get this from a table.
If you have to plot a graph for a formula, you first have to make the table yourself.
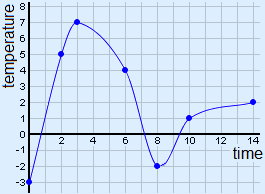
Example of a table.
| time | 0 | 2 | 3 | 6 | 8 | 10 | 14 |
| temperature | -3 | 5 | 7 | 4 | –2 | 1 | 3 |
To plot a graph, you first have to draw a coordinate system. The horizontal axis should always correspond to the top row of the table, the vertical as to the bottom row. Make sure your axes are about the same length and choose a good scale. After that you can draw points in the coordinate system. When you have these points, you draw a smooth line through these points. When all the points are on one straight line, you use a ruler to draw this line.
This is the graph that corresponds to the graph above.
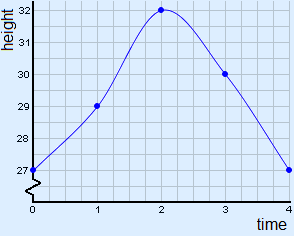
Zigzag
You can use a zigzag to skip part of the vertical axis. On the horizontal axis it is not necessary to show a zigzag.
Example
When making a graph to the following table, it is not really useful to make a coordinate system with a scale of 2 all the way to the origin on the vertical axis.
You will not use a large part of your coordinate system and the picture is distorted.
| time | 0 | 1 | 2 | 3 | 4 |
| height | 27 | 29 | 32 | 30 | 27 |
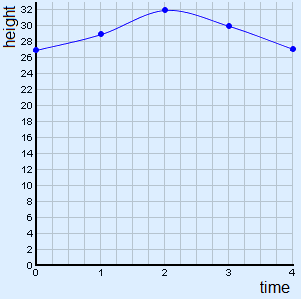
In this case it is better to use a zigzag.
NOTES:
- You may never draw next to a zigzag.
- A zigzag is like a sawtooth: once to the left and once to the right. Don't make a whole saw!