Formulas, graphs & relations » Mutations on formulas and graphs (translating and stretching)
Contents
1. Translation (addition)2. Stretching (multiplication)
1. Translation (addition)
You can change a graph by moving it vertically or horizontally. This is called translation.
Vertical translation (up/down)
To translate a formula vertically with q, you just add + q behind the formula. When translating down q is negative. To plot the new graph from the old graph is easy. Just read off every value, add q and plot the new graph.
Example
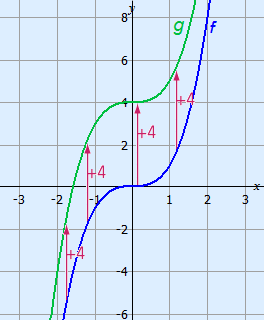
Below you can see how function f (x) = x3 is translated upwards by 4.
The function for the new graph is g(x) = x3 + 4.
Horizontal translation (left/right)
When translating a formula or graph horizontally to the right with p, you change every x in the old formula with (x – p).
When translating left p is negative. In that case you will get (x – (–…)) = (x + …).
For the graphs it works the same as above, only now you have to read off every point and you will have to plot the new points p to the right.
Example
The function f (x) = 2x2 + 3x is translated 5 units to the left.
The new function is g(x) = 2(x + 5)2 + 3(x + 5).
By removing brackets you will get:
| g(x) = | 2(x + 5)2 + 3(x + 5) |
| 2(x + 5)(x + 5) + 3x + 15 | |
| 2(x2 + 10x + 25) + 3x + 15 | |
| 2x2 + 20x + 50 + 3x + 15 | |
| 2x2 + 23x + 65. |
Vertical and horizontal
For a translation to the right with p and upwards with q, you will get translation (p, q).
For the standard formula y = axn then new formula will be: y = a(x – p)n + q.
2. Stretching (multiplication)
You can change a graph by multiplying it with a certain number. This is called stretching.
Stretching parallel to the y-axis
When stretching parallel to the y-axis with a factor a all outcomes of a formula are multiplied with a. The graph will be a times further from the x-axis.
The new formula can be easily found:
new formula = a(old formula).
Mind the brackets around the old formula!
Example
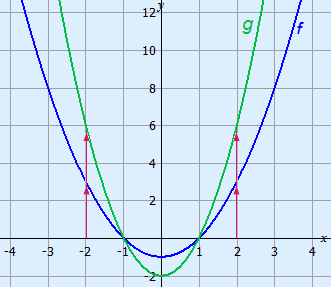
The graph of function f (x) = x2 – 1 is stretched parallel to the y-axis with factor 2.
All points of the new graph will be twice as far from the x-axis.
The function of the new graph will be g(x) = 2(x2 – 1) = 2x2 – 2.
Stretching parallel to the x-axis
When stretching parallel to the x-axis with factor a you substitute every x elke x in the function by (1ax).
When plotting the new graph it works the same, now the new points will have to be a times further from the y-axis.
Example
The function f (x) = 3x2 + 5x – 2 is stretched parallel to the x-axis with factor 4.
| The new function will be g(x) = | 3(14x)2 + 5(14x) – 2 |
| = | 3(14)2x2 + 54x – 2. |
| = | 3 × 116 × x2 + 114x – 2. |
| = | 316x2 + 114x – 2. |