Formulas, graphs & relations » Square root relation
Contents
1. General2. Formula
3. Table
4. Graph
5. Boundary point (Edge point)
6. Making formulas
1. General
A square root relation(ship) corresponds to a square root formula. Because the square root of a negative number does not exist (unless you are working with complex numbers), the graph will not exist there either. In almost all cases when working with square root formulas you have a certain domain and range. See theory about domain and range. Square root formulas are used, for example, when working with brake distances, calculating the side of a square or formulas that are based on Pythagoras' theorem.
2. Formula
Square root formulas always contain some form of y =  .
.
Examples are: y =  en y =
  .
.
The line of the root indicates what is 'in' the root. If you would use the bracket notation everything underneath this line will be between brackets.
Look at the difference: y =  en y =
  .
.
Be extra careful when working with your calculator. Some automatically fill in the first bracket, others do not.
3. Table
A table that corresponds to a square root formula will have lots of decimal numbers. But also a couple of whole numbers. This is, of course, because the square root of 0, 1, 4, 9, etc. will be whole numbers.
Other than this, there is no special way to recognize a square root formula from a table (like with linear, quadratic, inversely proportional and exponential relations).
Example
Table for y =  .
.
| x | 0 | 1 | 2 | 3 | 4 | 5 |
| y | - | 0 | 1 | 1.414... | 1.732... | 2 |
(when x = 0 you will get y =  = not possible)
4. Graph
When plotting a graph for a square root formula, try to find the domain first and then make a suitable table.
Below you can see the graphs of:
A: y = 
B: y = 
C: y = 
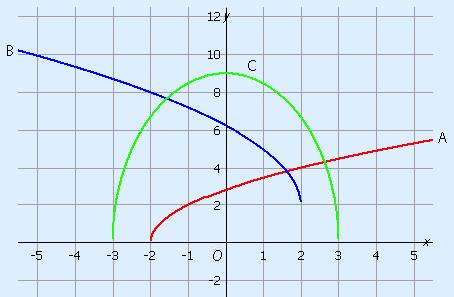
5. Boundary point (Edge point)
The point where the graph begins and in which the graph is almost vertical is called the boundary point. The boundary point can also be called the edge point. Formula C has two.
How can I find the coördinates of the boundary point?
The boundary point is where you have  .
.
You have to calculate when (for what x) you get 0 in the square root.
If necessary, you use an equation for this.
The y-value can be found by filling in the calculated x into the formula.
| Formula | Boundary point | Domain | Range |
| A: y = |
(–2, 0) | x ≥ –2 | y ≥ 0 |
| B: y = |
(2, 2) | x ≤ 2 | y ≥ 2 |
| C: y = |
(–3, 0) and (3, 0) | –3 ≤ x ≤ 3 | 0 ≤ y ≤ 9 |
6. Making formulas
Making a formula for a square root relation can be very difficult.
In case it is asked, the formula will not that difficult.
The simplest way is using a table.
Square everything in the table so you will get a row with y2.
| x | 0 | 1 | 2 | 3 | 4 | 5 |
| y | - | 1.414… | 2.449… | 3.162… | 3.7417… | 4.2426 |
| y2 | - | 2 | 6 | 10 | 14 | 18 |
Looking at the new row in the table you can find a formula. Find out what relation corresponds to the new row and make the formula. Most often the relation is linear.
In this case it is linear and it has the formula y2 = 4x – 2.
The formula for the square root relation is therefore y =  .
.