Statistics/Probability » Normal distribution
Do you have to calculate a probability using the normal distribution?
You can find this by 'Calculate area with normalcdf'.
Contents
When do you have a normal distribution?Standard deviation and percentages
Normal distribution on the graphical calculator:
- Calculate area/probability with normalcdf
- Calculate bound with invNorm
- Calculate μ or σ with normalcdf
- Where do you use normalpdf for?
When do you have a normal distribution?
Below you can see a bar chart with a normal distribution.
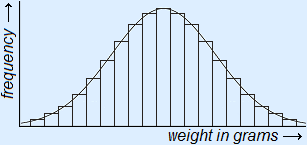
If you would draw a frequency polygon instead of the bar chart, you would get the graph / curve that is also drawn in the figure.
Below you can see the line graph again, but without the bar chart.
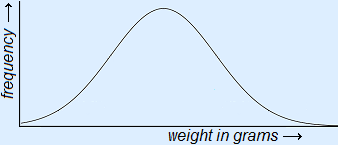

If the frequency polygon for a sequence of values has this shape, there is a normal distribution. A graph like that is called a normal curve. Is it also called a bell curve because of the resemblance to a bell. Hence the bell next to it.
The graph is symmetrical and mean, mode and median coincide. The mean of a normal distribution is called μ. This is the Greek letter m, which is pronounced as 'mu'.
Gaussian distribution
A normal distribution is sometimes called a Gaussian distribution. Carl Joseph Gauss was a German mathematician.
Examples
| - | the weights of 500 bags of coffee |
| - | the length of 15 year olds |
| - | the net volume of 1000 cartons of apple juice |
Standard deviation and percentages
As you can see in the graph with the bar chart, the area below the curve holds all values. This means that 100% of the values are underneath the curve. 50% to the left of μ and 50% to the right of μ.
Standard deviation
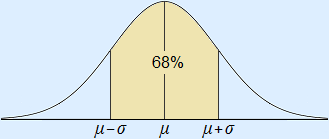
At a certain moment the graph changes from an increasing rise to a decreasing rise. The distance from this point to μ is called the standard deviation. Such a point can also be found on the right side of μ. The symbol used for standard deviation is the Greek letter σ. This is the 'sigma', almost everybody just says 'standard deviation' when they come across a σ in this context.
You may assume that in a normal distribution approximately 68% of the values are within a distance of σ from μ.
Furthermore you may assume that in a normal distribution approximately 95% of the values are within a distance of 2σ from μ.
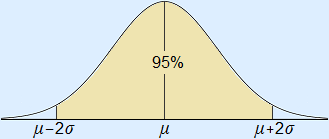
That leaves 5% of the values.
Those are further than 2σ from μ. 2.5% on both sides of μ.
When you put this information into one image, you will get this:
Click on the image to see a bigger version.
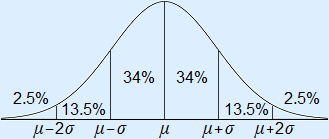
Note: These percentages are rounded off.
Click here when you want to know the precise percentages.
Example
A machine in a dairy company is filling milk cartons of 500 mL. It is set to precisely 500 mL. One of the employees checks for 150 cartons what the exact net volume is. He determines that the mean net volume μ of the cartons is indeed 500 mL. He calculates that the standard deviation σ of the machine is 12 mL.
Calculate how many cartons contain...
a ...less than 500 mL.
b ...more than 512 mL.
c ...between 488 and 512 mL.
Answers
Sketch the normal curve first.
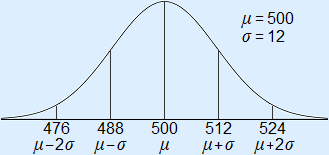
a 50% of 150 = 75 cartons
b 13,5% + 2,5% = 16% 16% of 150 = 24 cartons
c 34% + 34% = 68% 68% of 150 = 102 cartons
Normal distribution on the graphical calculator
Calculate area/probability with normalcdf
To calculate an area below the normal curve you use:
TI: normalcdf(l, r, μ, σ)
Casio: NormCD(l, r, σ, μ).
Here l is the left bound, r is the right bound, μ is the mean and σ is the standard deviation.
If there is no left bound, use –1099.
If there is no right bound, use 1099.
If you just use normalcdf(l, r), the calculator will take μ = 0 en σ = 1.
Example
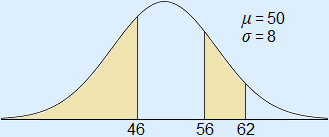
a Calculate the area left of 46.
b Calculate the area between 56 and 62.
Answers
a normalcdf(–1099, 46, 50, 8) ≈ 0.309
b normalcdf(56, 62, 50, 8) ≈ 0.160
As you can see, the answers are given as a number between 0 and 1. Remember that 1 is equal to 100%.
Probabilities
What if the questions in the example above where:
How big is the probability that a value of this sequence is...
a ...less than 46?
b ...between 56 and 62?
You do exactly the same, only in a different notation:
a P(X < 46) = normalcdf(–1099, 46, 50, 8) ≈ 0.309 ≈ 30.9%
b P(56 < X < 62) = normalcdf(56, 62, 50, 8) ≈ 0.160 ≈ 16.0%
Calculate bound with invNorm
To calculate a bound, you use:
TI: invNorm(area left of bound, μ, σ).
Casio: invNorm(area left of bound, σ, μ).
Example
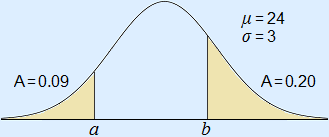
a Calculate the right bound of the left-hand area.
b Calculate the left bound of the right-hand area.
Answers
a a = invNorm(0.09, 24, 3) ≈ 20.0
b Left of b is an area of 1 – 0.20 = 0.80
b = invNorm(0.80, 24, 3) ≈ 26.5
Calculate μ or σ with normalcdf
The formula area = normalcdf(l, r, μ, σ) can be considered a formula with five variables. If the area is given and you have to calculate μ or σ, you can fill in all given information into the formula and you will get an equation that you have to solve.
But how can you solve an equation with normalcdf? With the graphical calculator!
Example
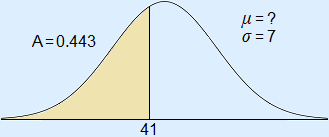
Answer
Fill in all given information into the formula. Use x for the unknown value.
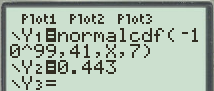
0.443 = normalcdf(–1099, 41, x, 7)
You can now use intersect on your calculator to solve this.
Fill in the parts of the equation as formulas to draw them.
Choose a sensible window size and use intersect to calculate the point of intersection.
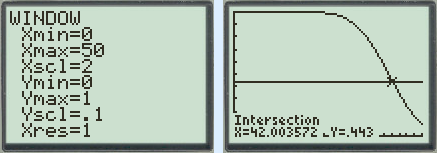
The mean μ ≈ 42.
Calculating σ goes the same way, of course.
Substitute x in your formula then for σ.
Where do you use normalpdf for?
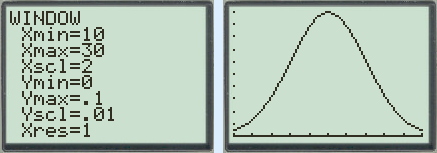
You cannot use normalpdf for calculating a probability or an area. However you can draw the normal curve on your graphical calculator with normalpdf.
TI: normalpdf(x, μ, σ)
Casio: normPD(x, σ, μ)
If you just use normalpdf(x), the calculator will take μ = 0 en σ = 1.
Example
Below you can see the graph of y = normalpdf(x, 20, 4).